Metrics on the Top 100 Most Visited Sites
Planted 02020-06-21
Looking for how your site stacks up against the top 100?
I pulled the top 100 most visited sites by organic traffic from Ahrefs data published May 12, 2020 and then measured the top 100 most visited sites for
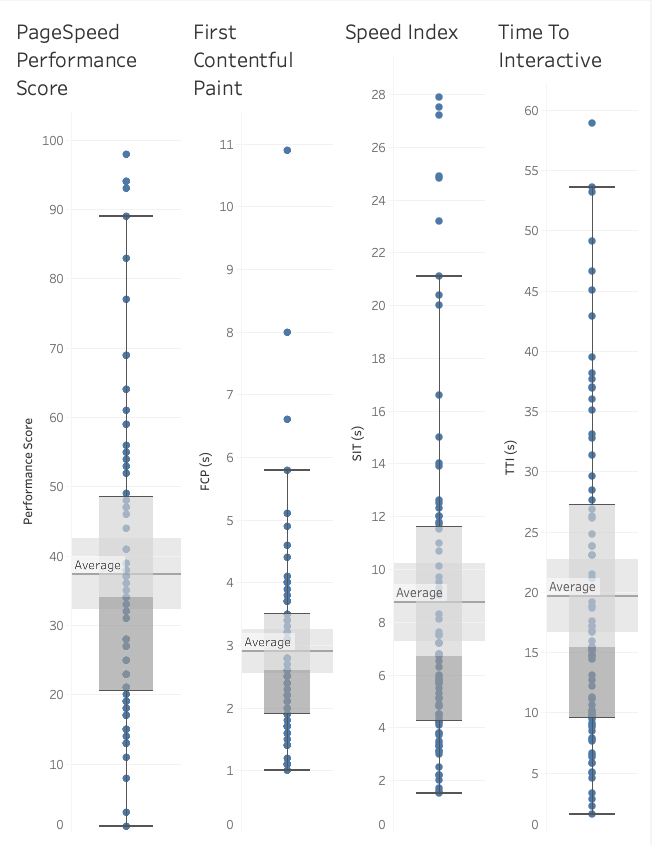
- PageSpeed Performance Score: a score determined by running Lighthouse to collect and analyze lab data about the page.
- First Contentful Paint (FCP): marks the time at which the first text or image is painted.
- Speed Index: shows how quickly the contents of a page are visibly populated.
- Time to Interative (TTI): the amount of time it takes for the page to become fully interactive.
- Average Title Length: The average length of the text displayed on SERPs as the clickable headline for a given result.
- Average Meta Description Length: The average length of the text displayed on SERPs as the description for a given result.
- Average Word Count: The average length of all ‘words’ inside the body tag.
Here’s what I found.
Overview
Metric Averages:
- PageSpeed Performance Score: 37.4
- First Contentful Paint (FCP): 2.9s
- Speed Index: 8.7s
- Time to Interative (TTI): 19.7s
- Average Title Length: 44
- Average Meta Description Length: 146
- Average Page Size: 301 kb
- Average Word Count: 1,144
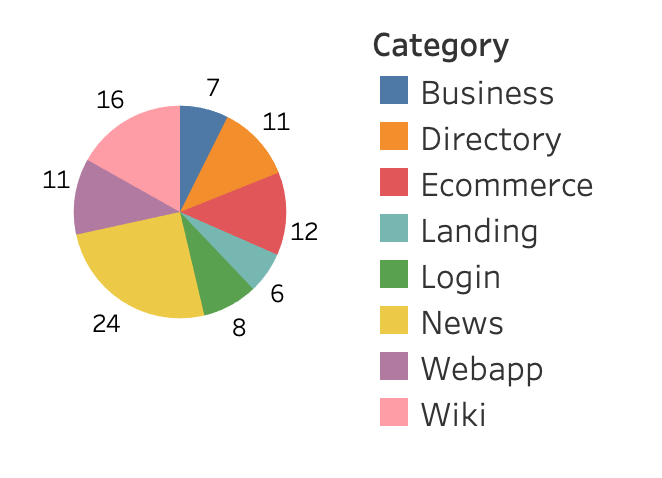
To get a little more granular I decided put each of the top 100 into a category.
- Business (e.g. Apple.com, Chase.com)
- Directory (e.g. bbb.org, indeed.com)
- Ecommerce (e.g. amazon.com, ebay.com)
- Landing (e.g. hulu.com, linkedin.com)
- Login (e.g. facebook.com, quora.com)
- News (e.g. nytimes.com, forbes.com)
- Webapp (e.g. youtube.com, apartments.com)
- Wiki (e.g. genius.com, mayoclinic.com)
Category PageSpeed
Median Category Scores: (Higher is better)
- Business: 41
- Directory: 49
- Ecommerce: 36
- Landing: 59
- Login: 47
- News: 23
- Webapp: 34
- Wiki: 25
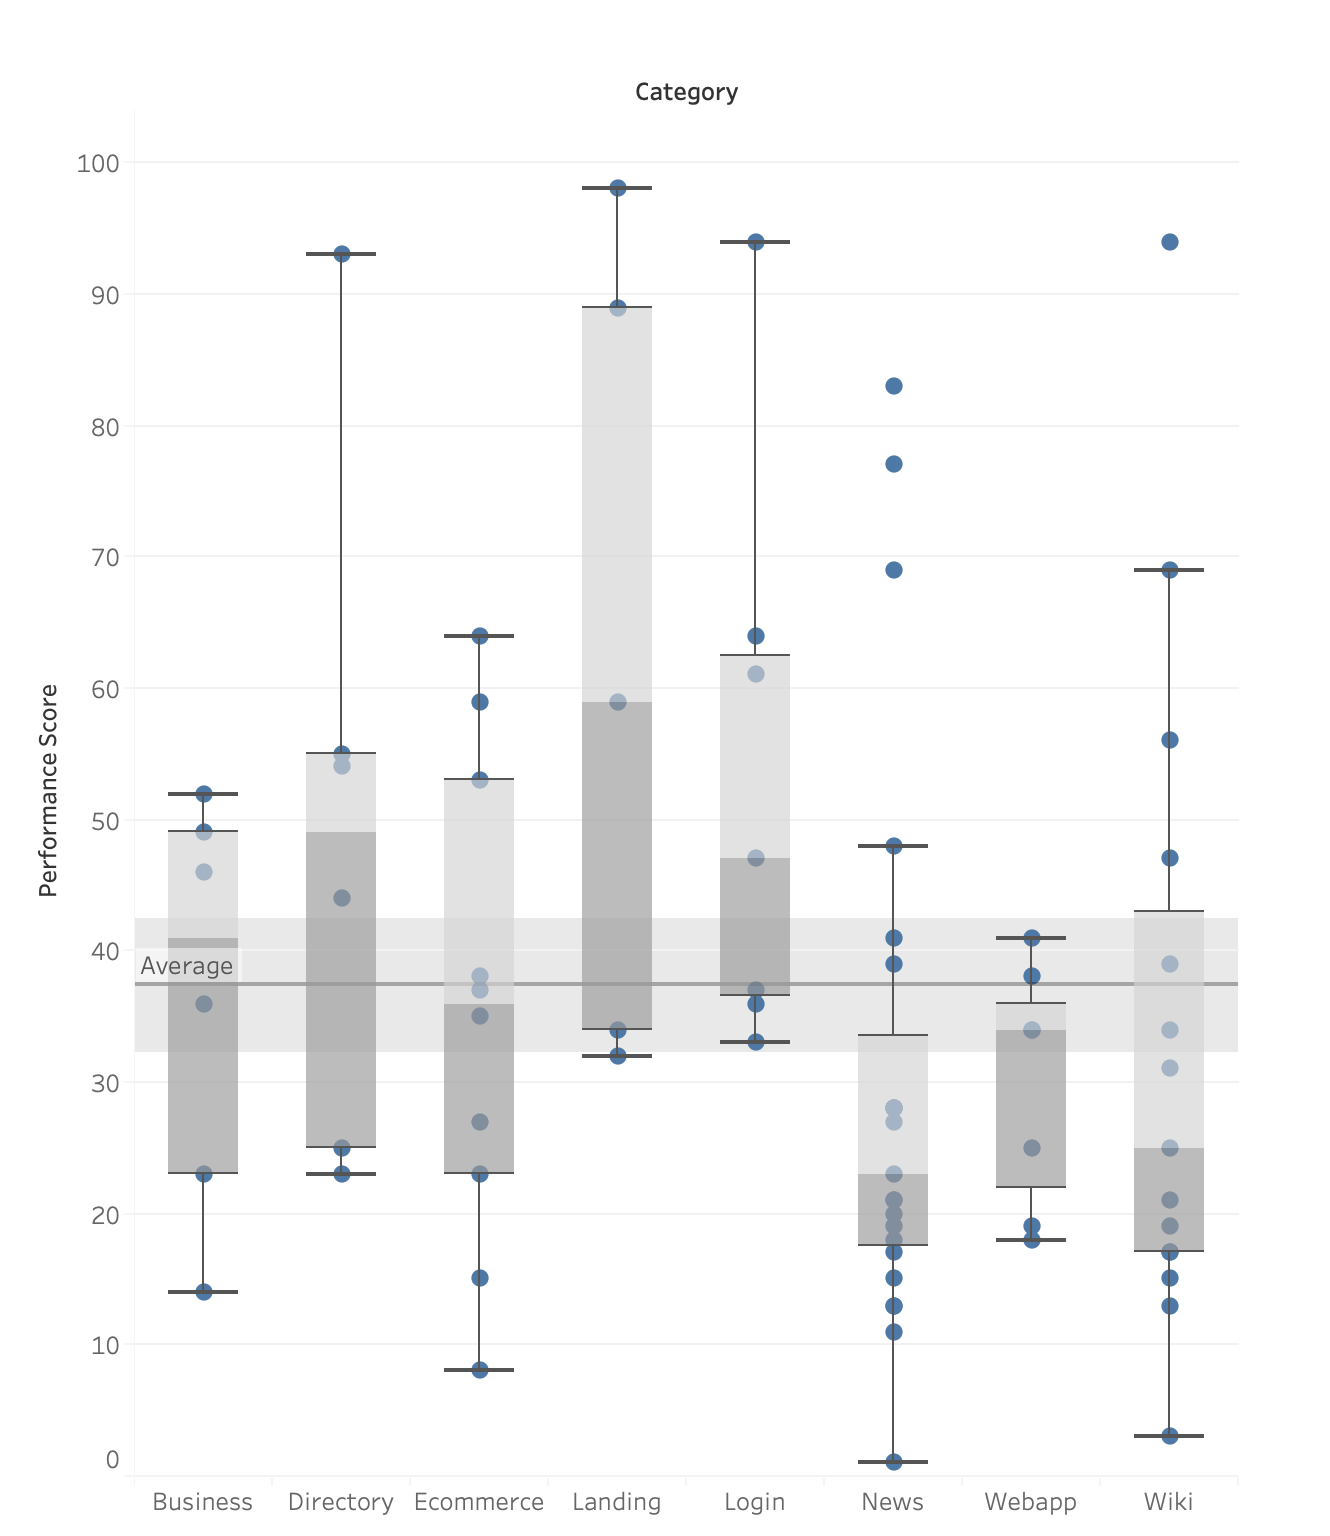
I find it saddening to see News sites performing the worst. Do note: this metric is not useful for determining actual site performance. Landing pages being the highest makes sense. With Directory and Login pages not too far behind.
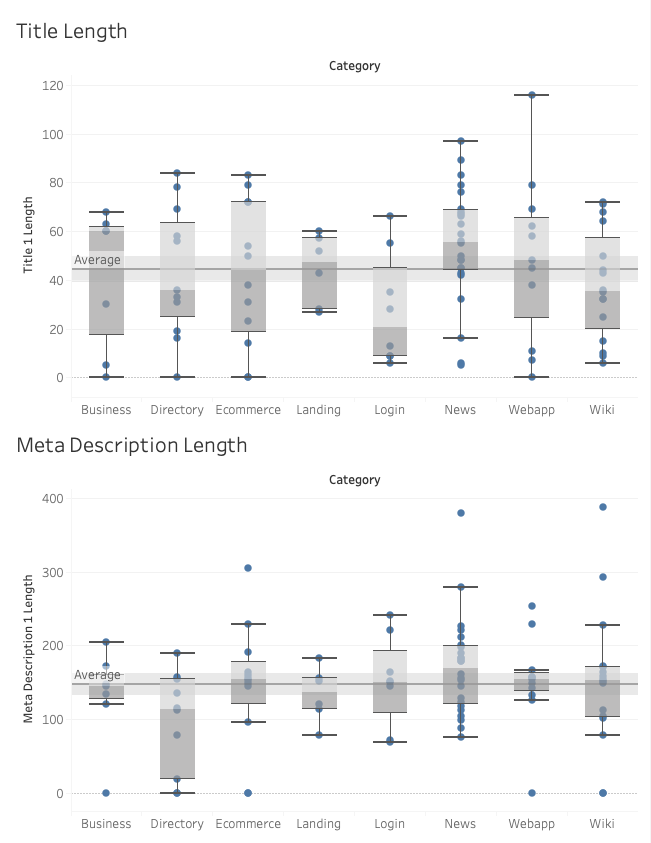
Category Title and Meta Description Length
Title Length Median:
- Business: 60
- Directory: 36
- Ecommerce: 44
- Landing: 47.5
- Login: 20.5
- News: 55.5
- Webapp: 48
- Wiki: 35.5
Meta Description Length Median:
- Business: 144
- Directory: 113
- Ecommerce: 154
- Landing: 136
- Login: 150
- News: 170
- Webapp: 154
- Wiki: 153
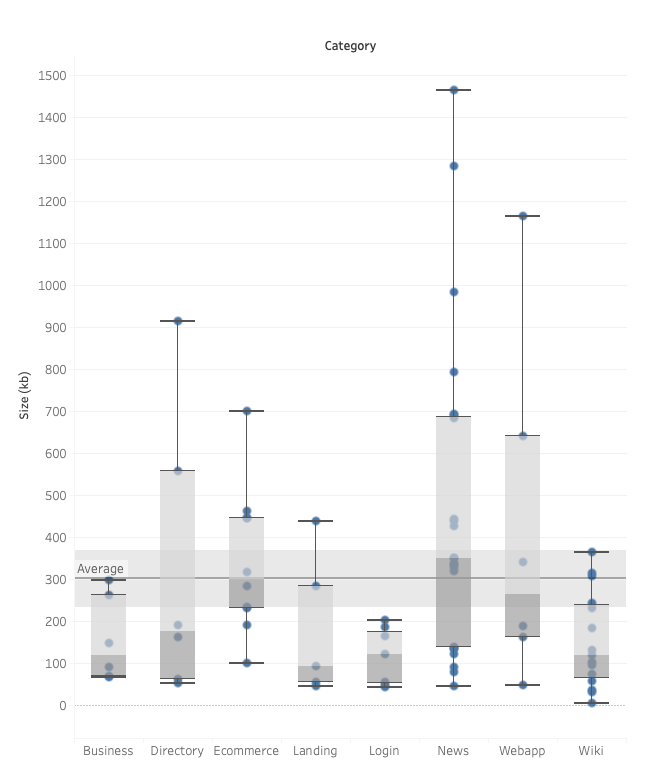
Category Page Size
Median Page Sizes (kb):
- Business: 119
- Directory: 175
- Ecommerce: 229
- Landing: 93
- Login: 121
- News: 349
- Webapp: 264
- Wiki: 119
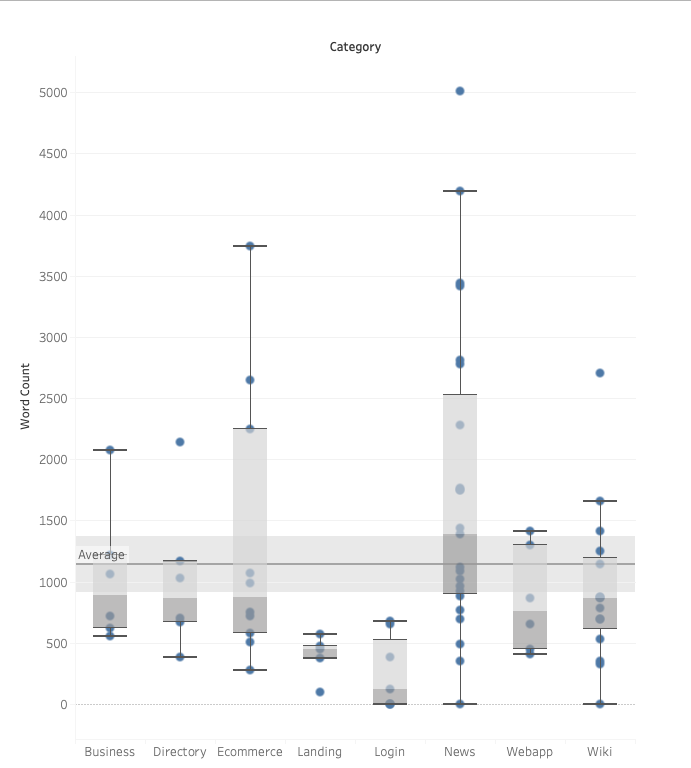
Median Word Count
- Business: 891
- Directory: 865
- Ecommerce: 873
- Landing: 446
- Login: 121
- News: 1,385
- Webapp: 757
- Wiki: 863
With Web Vitals becoming ranking factors in 2021 I want to collect data on LCP, FID, and CLS at some point . Hopefully those performance numbers will improve in the future, let’s make a better web.
If you see a mistake or have a question, feel free to reach out through this site or on Twitter.